Ahead of the UN Climate Change Conference (COP27), the latest round of climate talks taking place in Sharm El-Sheikh (Egypt), the IEA is delighted to inform all data users of the release of the 2022 version of its Energy and carbon tracker. The interactive product showcases a wide set of indicators to analyse historical trends of greenhouse gas (GHG) emissions, energy, power and sectoral patterns at country level. This product is published in excel format and includes graphs of time series and decomposition analyses, also allowing for country comparison.
The product is derived based on data from the 2022 editions of the IEA World energy balances, Greenhouse Gas Emissions from Energy and Energy efficiency indicators. The user-friendly design allows visual presentation of a set of analyses which help tracking decarbonisation levels for each country and globally.
The Tracker includes annual data from 2000 to 2021 for selected indicators for all OECD countries, the IEA Family and other selected countries; and up to 2020 for the global set of indicators for over 160 countries and regions.
The Tracker includes graphs and data for the following indicators:
- Total GHG emissions from energy by product
- Total GHG emissions from fuel combustion by sector and by product
- Total fugitive GHG emissions by energy sector and by type of gas
- Shares of fugitive and fuel combustion emissions
- GHG and energy related socio-economic indicators
- Total energy supply by source and by product
- Sectoral shares in total final consumption
- Power generation and sectoral CO2 emissions from fuel combustion by product
- Share of power generation by product
- Drivers of CO2 emissions from electricity generation
- Sectoral energy consumption by product
- End-use energy consumption by sector
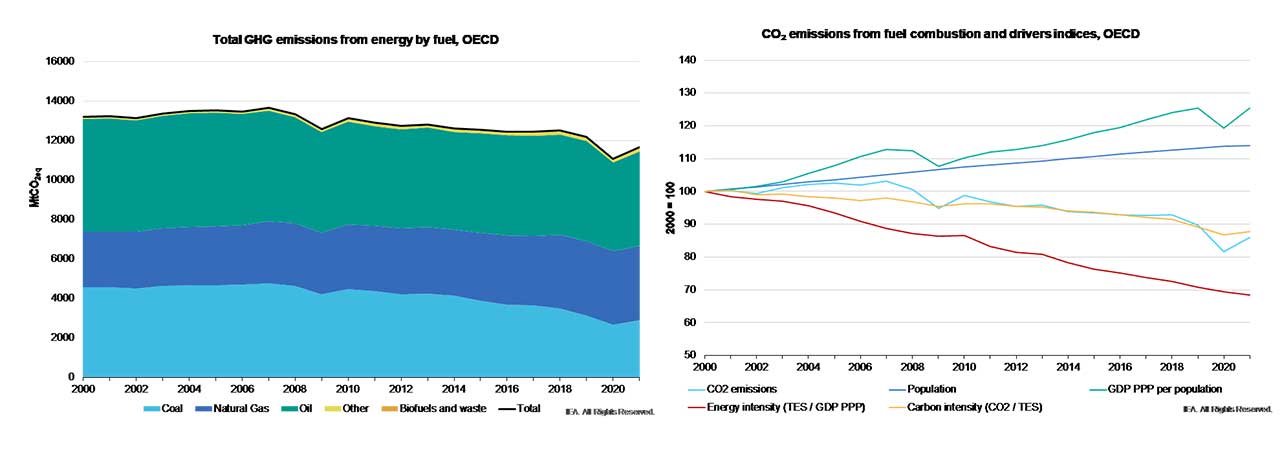
Understanding the fuels, sectors and macro-economic factors driving GHG emission trends is pivotal to address the priorities needed to achieving energy and climate targets. As illustrated below in the decomposition of CO2 emissions into four macro-economic driving factors, in 2021, the GHG emissions of OECD countries rebounded after the 2020 drop. The rebound was due to the strong economic recovery from the Covid-19 crisis, coupled with an increase in the carbon intensity of the energy mix – the latter driven by the recovery in transport activities and the increased use of coal for power generation.
GHG emissions from energy in OECD countries rebound after the impacts of Covid-19

Power sector’s transformation is critical to clean energy transitions, as the sector accounts for over 40% of CO2 emissions from fuel combustion globally. As the recent years have taught, reducing the carbon dependency of the power sector is also in the core of global energy security. As illustrated below, the Tracker includes a feature which allows comparison among multiple countries and regions.
Tracking power generation
Source: IEA Statistics