Danny Constantinis (Executive Chairman & CEO) EM&I Group, Malta.
Data Analysis and Artificial Intelligence (AI) are the keys to safe and efficient integrity management.
It is probably no exaggeration to say that over 90% of data collected is wasted along with the cost and risk of gathering it.
Why is this?
The first reason is that prescriptive regulations calling for the data is a shotgun approach based on the lowest denominator in terms of asset condition; in other words, gather lots of data, hope to find one or two useful bits of information that confirm base compliance and discard the rest.
The second reason is that until the growing understanding of data analysis and AI it has been too difficult to analyse the data quickly or cost effectively.
The third reason is that new, robotic, and remote inspection methods gather so much data which makes the situation worse.
So, what is our industry doing to remedy this?
The JIP (Joint Industry Project) for HITS (Hull Inspection Techniques and Strategy) has stimulated thinking on this topic because of the increasing application of remote technologies that collect vast amounts of data that can be analysed to provide useful insights into asset condition and trends.
There are a number of challenges and solutions… what data (and metadata) do we collect, how frequently and by what methods do we collect it and how do we manage and analyse it?
Many of these questions can be addressed through using a Risk Base Integrity strategy rather than following prescriptive rules.
Risk Based Strategy…
Risk based strategies for assuring equipment integrity are efficient because they target known critical areas. This makes RBI and remote inspection systems highly compatible because it avoids gathering unnecessary data. However, RBI does require knowledge of the equipment design, inspection, maintenance, and operating history.
Let’s consider how a structural RBI might work for a floating offshore asset such as an FPSO.
Rather than follow prescriptive class rules that require inspection data irrespective of the specific integrity risks of the structure, the RBI approach will focus on gathering data relevant to the structure in question.
An RBI Inspection Plan and Work Packs will be developed by a group of people knowledgeable in the RBI process and experienced in the history and operation of the asset.
The Inspection Plan identifies what, how and when of the data gathering process, generally seeking to extend inspection intervals where appropriate.
Often the increased inspection intervals may be contingent on some form of confirmatory visual inspection, and this is where a remote system such as NoMan and UAVs, comes into play but more about these later.
What data do we need to collect and how?
In the case of structural integrity on an FPSO, for example, we might collect visual inspection, distortion, thickness, and coating data but should we also collect metadata such as the loading condition, ambient conditions, sea state, etc.
How we collect the inspection data is a rapidly changing topic being discussed across the industry in JIPs such as HITS (Hull Inspection Techniques and Strategy).
Key drivers include safety, cost, sustainability, and environmental aspects especially reduction in carbon emissions.
Looking at these in turn…
Safety – we need to avoid putting people at risk, for example by requiring them to work at height, in confined spaces or in dangerous environments such as working underwater to gather integrity information. It is often difficult to justify the benefit of inspections to protect life when there are fatalities involved in gathering the data to do so.
Solutions to this dilemma include using robots and modern, data gathering technology such as remotely operated cameras and laser scanners to gather data.
This type of solution goes a long way to resolving the second challenge of cost and operational efficiency.
Making an environment safe for humans is much trickier than making it available for a robot.
For example, the time taken to clean and make a confined space such as a cargo oil tank safe for human entry could take weeks for a team of people, all the while being exposed to safety risk and making the tank unavailable for operational use…..we must waste millions of dollars a year in this activity to very little purpose.
Having got the robot into a tank we now need to decide what data we want it to collect.
NoMan deploys remotely operated robotic cameras that can carry out a confirmatory visual inspection in a matter of hours without the safety risk and many days required to prepare for man entry into the confined space of a structure.
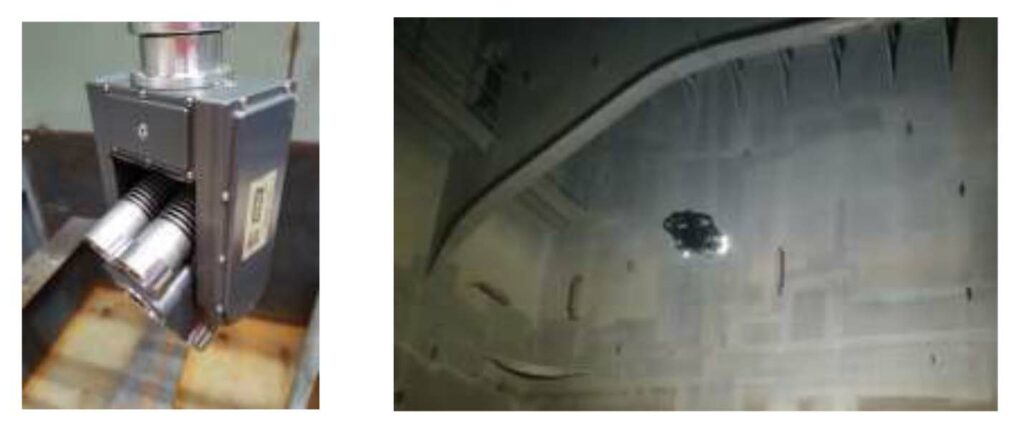
The visual data gathered can be supplemented by synchronous laser surveys that define the shape, size, deformation and thickness of the structure, coatings, tank cleanliness, etc., thus providing the current condition status and an accurate assessment of future trends.
From a practical perspective, tank cleanliness is vital to gathering meaningful data and nowhere is this more important than for the bottom plating structure which is difficult to clean and susceptible to pitting corrosion and we will discuss this challenge later.
Similar arguments apply to diverless solutions for underwater surveys, diving being a hazardous business with fatalities regularly recorded.
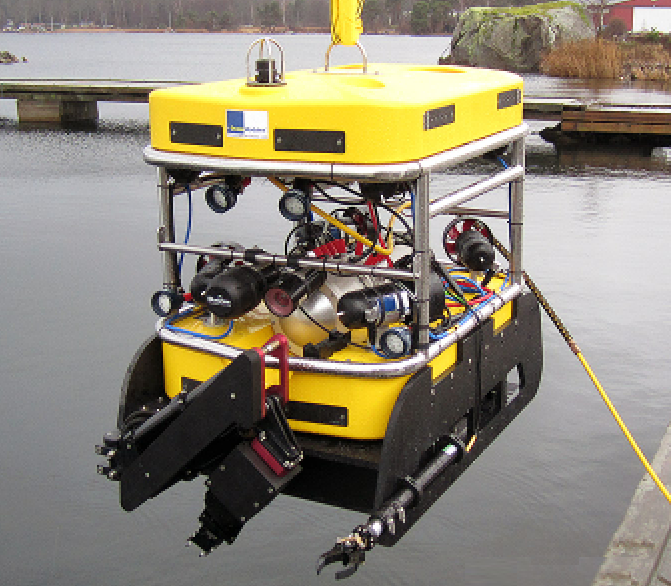
Modern Integrity Class ROVs gather visual, NDT, corrosion protection and dimensional data, without putting people at risk.
Ongoing developments are increasing the capabilities of these robotic subsea systems even to the point of being able to carry out a wide range of repairs to underwater structures, valves and so forth.
So now that we have an increasing number of tools for deciding what data to collect and safer and more efficient ways of gathering the data, we come round to the point of data analysis and use of machine learning and AI.
Let’s start by taking the example of the large number of ultrasonic thickness readings taken on pressure systems and structures.
The RBI strategy will identify where to look and how frequently with the consequence of many thousands of readings gathered.
The basic current analytical approach is limited to looking for thickness reading out with the guidance of codes such as API. Other readings that indicate that thickness is within limits is filed or discarded even though it contains highly valuable information that can reduce risk, cost, and assist trend assessments and planning.
One solution, designed for pressure system thickness inspection data is a software programme called ANALYSE (PSI)™ which uses algorithms developed with a leading London University to statistically decide what data we need to achieve a desired level of confidence and then feeding back actual data to confirm the condition of the equipment inspected.
This has been applied fleetwide for a major operator and has now extended to a number of pilot programmes for other operators, with clear demonstrations of cost benefits in excess of 50% savings.
ANALYSE has been further developed so that other data sets can be analysed for example visual data gathered by robotic camera as well as synchronous laser thickness and distortion data on structures.
The visual data is a target for developing machine learning capabilities whereby computers can be taught to recognise and measure anomalies such as coating damage.
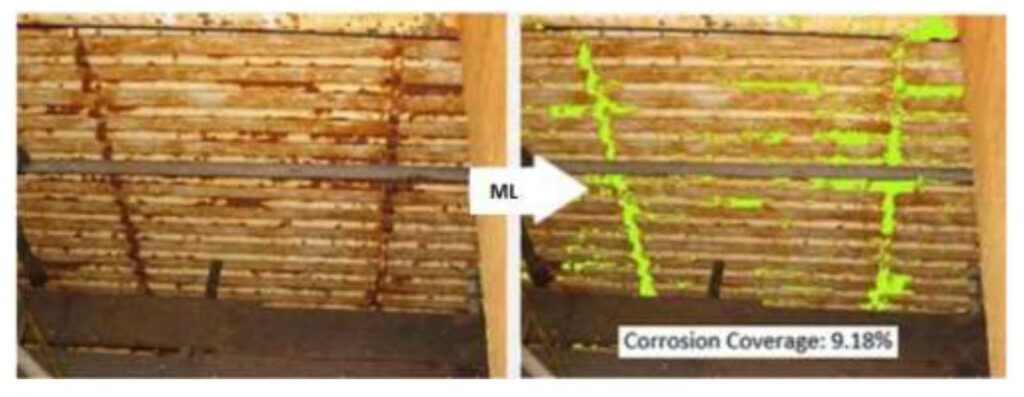
The question of using machine learning to interrogate images is vital – scanning hours of video footage or images is not a productive job for humans and introduces the potential for boredom, loss of attention and errors.
However, machines while unlikely to get bored, are difficult to ‘train’ with much time and effort required to teach them even basic image recognition, a task which a human can carry out almost instinctively.
Many software security systems use the ability of humans to readily recognise objects and images to make sure robotic systems can’t access systems designed for human access only.
But can laser data be analysed by machines?
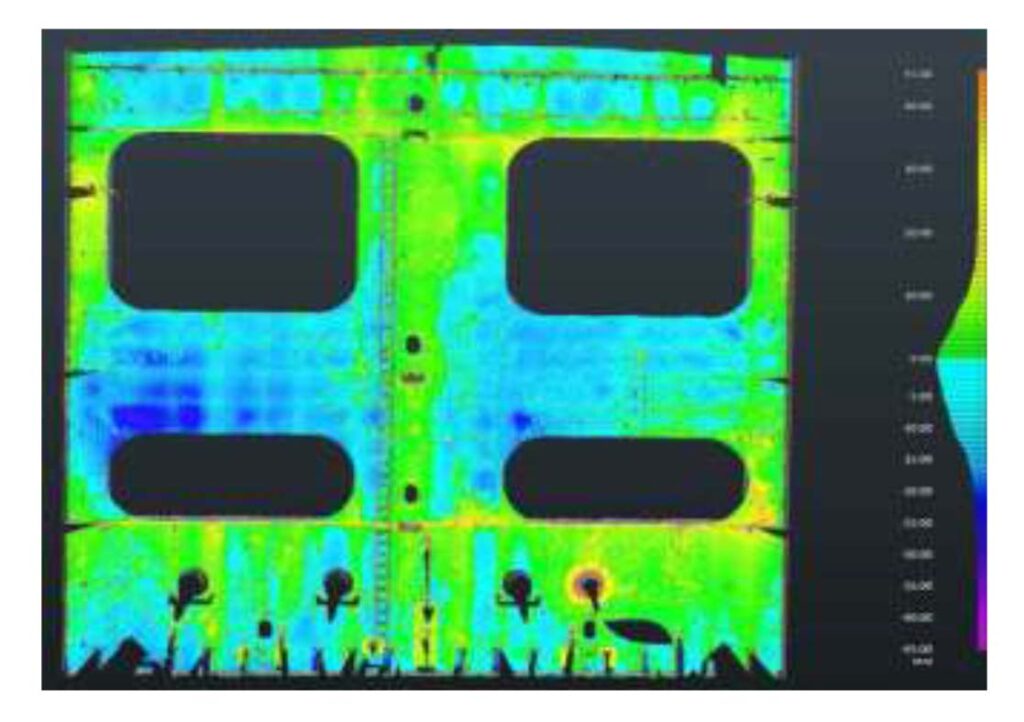
The images above are digitised and designed for machine analysis.
It’s quite easy to ask a computer to identify any areas of distortion outside a predetermined limit or changes in the distortion pattern over time or with different loading conditions.
The NoMan laser data provides clear indications of corrosion and coating breakdown which can be verified by the visual data, both using machines taught to recognise and measure the level of damage.
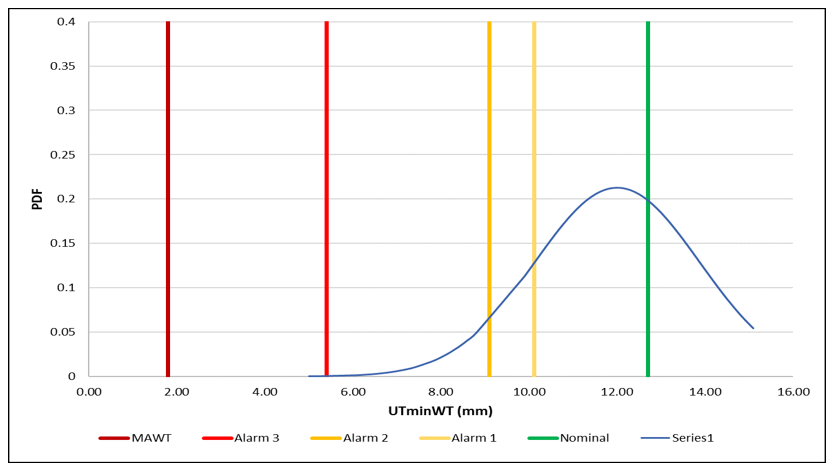
Statistical analysis of the data also reveals much more than the traditional approach of seeking the thinnest readings taken and discarding the remaining 90%.
Algorithms developed with a leading London University are being widely used to determine the minimum thickness with known levels of confidence, even though the minimum measurements were not detected or recorded.
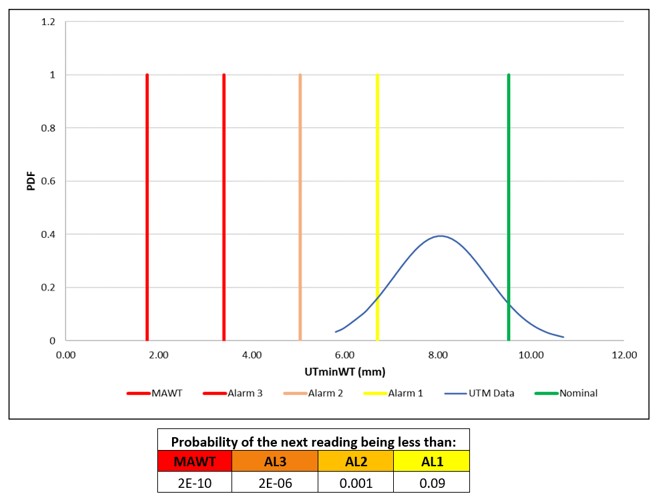
This type of analysis also guides how many readings are needed to achieve the required confidence levels based on statistical analysis of historic data.
The ANALYSE system has been proven to save over 50% of the data collection cost as shown by a few of the case studies summarised below.
Case studies – Pressure System inspection
Recent projects applying ANALYSE to pressure system inspections have already shown significant savings as follows:
- On an FPSO in Malaysia UTM (Ultrasonic Thickness Measurements) were reduced from 2,819 conventional UTMs to 1,444 ANALYSE readings, producing a 49% saving.
- On an FPSO in Australia UTMs were reduced from 210 conventional UTM readings to 78 ANALYSE readings producing a 60% saving.
- On a Semisubmersible platform in the GOM (Gulf of Mexico) UTMs were reduced from 1,056 to 258 ANALYSE readings producing a 76% saving.
- On a Semisubmersible in the GOM 17,799 conventional UTMs were reduced to 8,807 ANALYSE readings producing a 51% saving.
- On an FPSO in Brazil 393 conventional UTMs were reduced to 90 ANALYSE readings producing a saving of 77%.
- On a processing hub in Australia 4,546 conventional UTMs were reduced to 972 ANALYSE readings producing a saving of 79%.
- A Supermajor in the GOM saw reductions of over 50% achieved across a whole field.
So, the average saving was proven to be well over 50%, with a further benefit of a quantified level of confidence in the reliability of the data which was set in accordance with industry guidelines.

It is clear that data analysis and AI combined with an RBI strategy and robotic data collection systems are the future of asset integrity management in our industry.